Monthly reports
Opportunities
I am a happy zero-based budgeting adopter, mostly through the YNAB app. Through their APIs, Martin integrates with YNAB to store a duplicate of all transactions in its database, complete with category and description. I believe this is a potentially useful set of data, one that is not usually available to oneself, and I wondered if there was an opportunity behind that.
What can I build with it?
I think any more knowledge about my financial status makes me feel more relaxed. Some examples of how this benefit can be triggered:
- knowing that your expenses are under control, and if your spending habits will become unsustainable you can realize that before any real problem might appear
- having a chart that confirms you’re saving money, despite how fucking expensive having a kid is
- being able to be more transparent through data - put in an accessible and intuitive way - about our financial situation with my wife, or even my relatives
I think these small things could generate, at least in me, an increased sense of relaxation and stability. I know what is happening, things are enough under control, I can stop worrying about them and focus on something different - or just chill. That might turn out to be false: after all, some degree of ignorance and superficiality about some aspects of life is crucial to avoid obsessive thoughts about it. There’s room for an experiment.
YNAB does offer some insight on how the money was spent in a time window, but I’ve found their report not customizable enough for my purposes. Can I make something more tailored to my needs? Can I create more advanced reports?
At the same time, I want to experiment again with printed paper. I believe the experience of accessing information changes significantly when you don’t have to access it through a computer. A personal computer is a crowded place nowadays. Everything on it competes for your attention, and in my case it’s also where a pile of unfinished things I started earlier sits waiting. In certain moods I feel a real resistance to even opening it. I think Martin - and software and hardware in general - should offer more focused, gentler experiences, ones that barely feel like using a computer at all.
It’s Sunday morning; we just finished eating pancakes on our big wooden table while listening to Radio Swiss classic. While the kid is now playing with his toys my wife and I are drinking some long American coffee on the couch; the windows are open, the temperature is gentle, life is slow. Since a couple of days have passed since the beginning of the month, now our monthly report is ready; I printed it a couple of days ago, and now I can take it out. My wife and I look at the charts, we discuss the trends, if our experiments did play out, if nothing unexpected came by. We found we’ve spent more or less what we hoped, and the feeling of having our finances under control boosts our confidence in our abilities to build a future together.
Then we finish the coffee and we head up to a museum, since they’re free on the first Sunday of the month.
The report
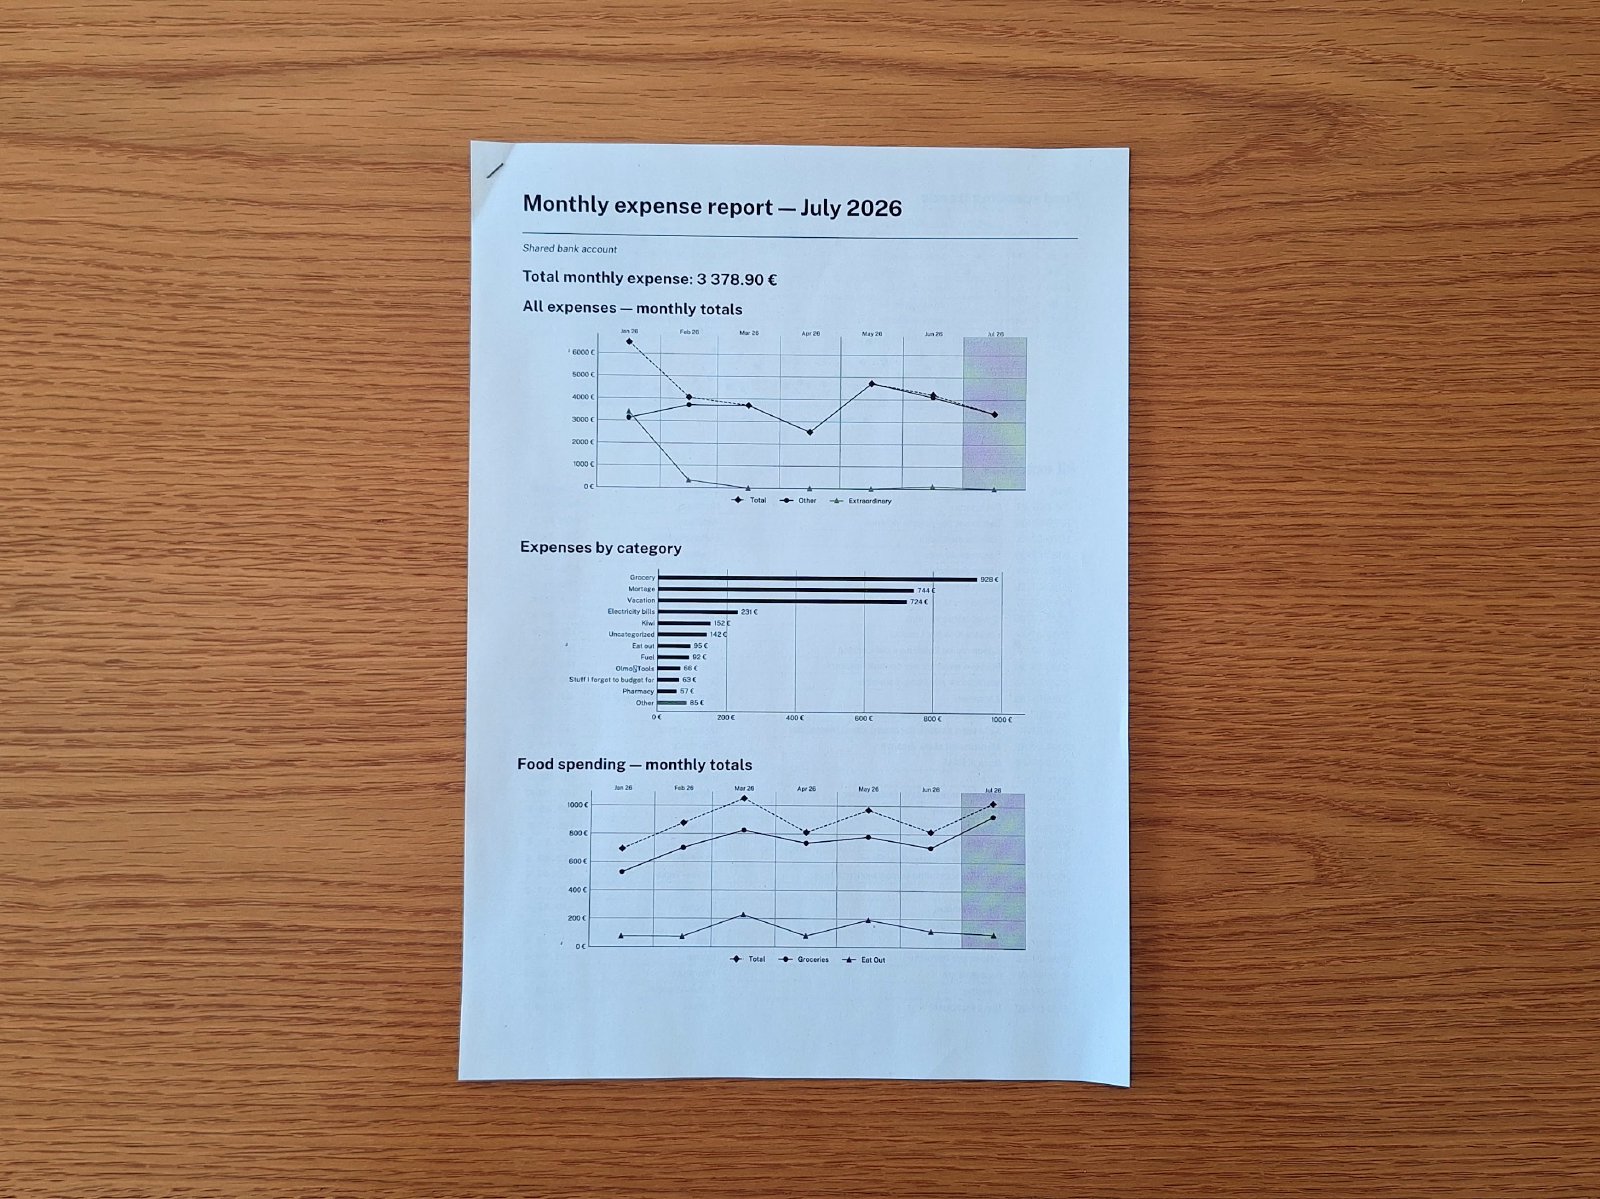
So I ended up with a basic “monthly report” of our family’s bank account movements. It’s nothing impressive, but it’s useful. The report contains the list of all our transactions in the previous month, plus a couple charts to make some trends more understandable:
- a line chart for total month expenses of the last 7 months (current + 6 in the past), where the “extraordinary” category has been marked as a separate line to keep the house renovation from making “common” expenses invisible;
- a horizontal bar chart with the expenses by category;
- a line chart with food expenses of the last 7 months, with individual lines for groceries and eat outs;
- a dot chart with every food-related transaction, with different icons depending on its category
The really interesting part of the development, at least at the product level, was working out which charts were meaningful to us. Apart from the obvious ones like “total expenses” and “expenses per category”, what is interesting to us? What do we want to keep on our radar? On what expenses do we have more control, if things derail? What is more susceptible to turbulence, and what instead is quite predictable?
The reasoning that came out of these questions was valuable. We have a degree of control over our food expenses, which can shrink or grow depending on how much we eat out, or how much we rely on our vegetable garden (which went pretty bad this year BTW). Aside from that, the real discovery was that we had no clear idea of what we could and should be looking at. We had little control over what we spend daily, we just spend according to the needs that arise in front of us, without having real levers on our daily life. We can decide to spend a little less one week by not taking pizzas from a restaurant, sure, but that’s it.
This finding is a bit concerning but also valuable. The first prototype of this report will hopefully deepen our family conversation about how to gain more levers of control over our daily expenses, so that we know where to cut costs if we ever need to.
Tools
On the technical side, I took the chance to have a look at Typst to implement this feature. I’ve heard very good things about it, and I like how it allows you to start easy without putting a hard ceiling on what you can get. And after looking at Typst universe, I mean… the brain flooded with possibilities of future implementations. Martin will continue to experiment with the paper medium, so I might as well create freaking cool PDFs.
For the charts I relied on Matplotlib. I’m not super-convinced, as I would have preferred using a Grammar of Graphics-inspired library. However, I’m still not sure how charts will be used in Martin: I already foresee a new feature where I want to display some interactive charts on the web interface, and I’m not sure if I should use the same charting library for both PDFs and web, or pick different ones since they need to best serve different needs. I picked the safest choice, and I’ll come back to that in the future.
The reports are shaped using the component pattern, each chart being a component that is given the biggest possible set of data the report is interested in, and then proceeds to find its own meaningful data and return a Typst string. It looks nice, I like the component model, which painfully reminds me how much I struggle with Django templates.
Talking about struggle, I also took some time to experiment with alternatives to Python’s list comprehension. After years of
fp-ts, and being generally a big supporter of the pipe operator in its various implementations, I find Python [fn(x) for x in y if ...] counterintuitive, and with limited composability. Also, I need to admit my limits towards lazy evaluation. I still don’t see how making it the default improves the language.
Anyway, in the attempt to bring into Martin some more familiar FP patterns, I installed the toolz package and built some additional helpers over it, like:
from toolz import curry

@curry
def lmap(f, seq):
   """Curried, data-last, non-lazy map for Python iterables"""
   return list(map(f, seq))
The idea was to be able to use pipe and functions like lmap and lfilter over non-lazy arrays, mimicking what I did in previous contexts. So far the results have been disappointing, as I’ve used pipe zero times, and I’ve been able to benefit from lmap’s currying only once.
I’m a bit torn, I don’t think a dependency to an external package plus using a language in unorthodox way is worth the little benefit I am getting with these helpers. But I’ll keep them for a couple months more, see how they play with the codebase, and decide later.